Vietnam rainy season: the wettest month in each place
There's no month when all of Vietnam is dry, but February comes closest.
VerdictAim for February if your route crosses regions, and give the central coast the most caution.
The Vietnam rainy season depends on where you are. The north peaks between July and September, the central coast peaks in October, and the south peaks between August and November. The table below gives the wettest and driest month at 14 of the 15 places on our map, with the months that pass 250 mm. Ho Chi Minh City is left out because no station rainfall table we could read covers it.

None of our sources defines a rainy season. We use a plain rule: a month is wet when it has more than 250 mm of rain. That threshold is ours and is the same one the weather by month page uses. Months near the line are close to the next label.
Wettest and driest month by place
| Place | Wettest month | Rain mm | Driest month | Rain mm | Months over 250 mm |
|---|---|---|---|---|---|
| Hanoi | Aug | 309.4 | Dec | 20.2 | Jun, Jul, Aug |
| Ha Long Bay | Aug | 430.5 | Dec | 18.1 | Jun, Jul, Aug, Sep |
| Sa Pa | Jul | 461 | Dec | 65.7 | May, Jun, Jul, Aug, Sep |
| Ha Giang Loop | Jul | 545.3 | Feb | 38.8 | May, Jun, Jul, Aug |
| Ninh Binh | Sep | 362.4 | Feb | 26.4 | Aug, Sep |
| Phong Nha | Oct | 649.1 | Feb | 39.9 | Sep, Oct, Nov |
| Hue | Oct | 772.7 | Mar | 51.3 | Sep, Oct, Nov, Dec |
| Hoi An & Da Nang | Oct | 628 | Feb | 23.6 | Sep, Oct, Nov |
| Quy Nhon | Oct | 521 | Feb | 28.2 | Oct, Nov |
| Nha Trang | Nov | 381.6 | Feb | 16.1 | Oct, Nov |
| Da Lat | Sep | 283.4 | Jan | 9.1 | Sep |
| Mekong Delta | Oct | 300.9 | Feb | 3.8 | Sep, Oct |
| Phu Quoc | Aug | 485.6 | Feb | 27.2 | May, Jun, Jul, Aug, Sep, Oct |
| Con Dao | Oct | 350.6 | Mar | 11.2 | Jun, Jul, Aug, Sep, Oct |
Ho Chi Minh City has no rainfall table in the station sources we could read. We left out a model estimate for the city because we could not check it against a published table.
The north: July to September
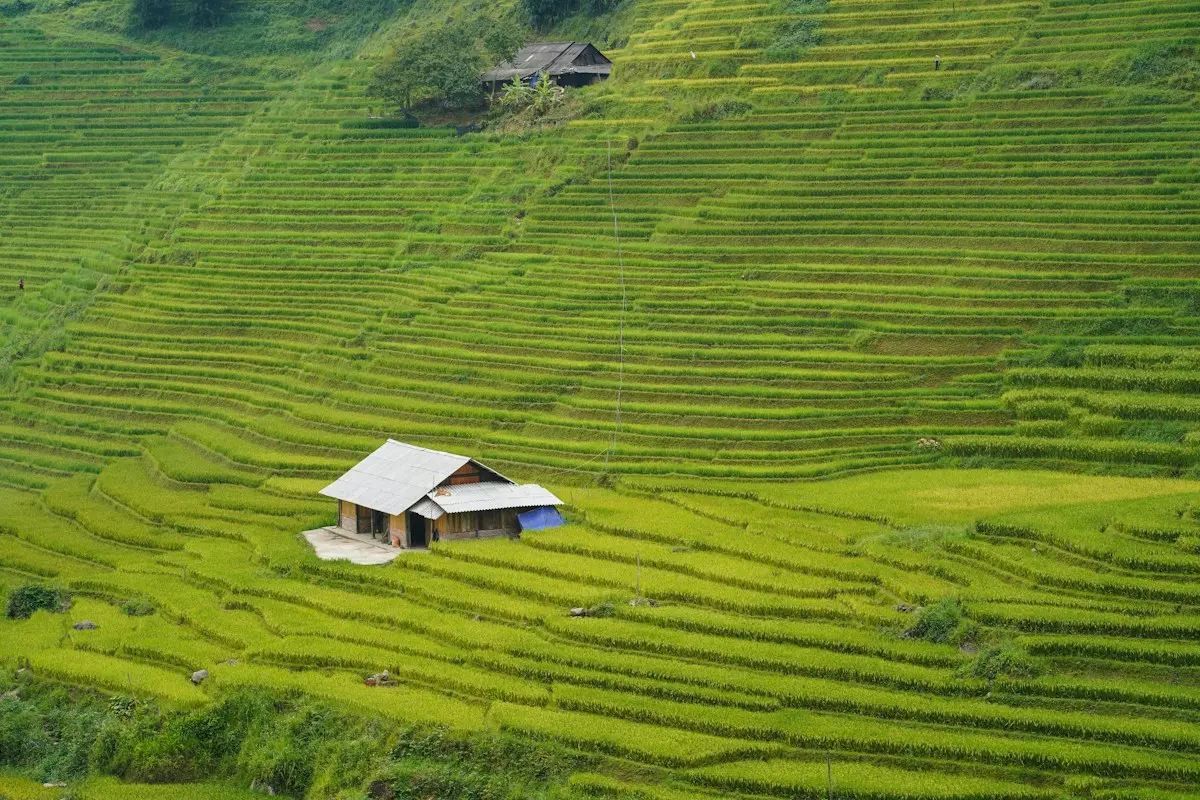
Hanoi and Ha Long Bay peak in August at 309.4 mm and 430.5 mm. Sa Pa and Ha Giang peak in July at 461 mm and 545.3 mm, and Ninh Binh peaks in September at 362.4 mm. Sa Pa has the longest wet season in the north: it passes 250 mm in five months, from May to September. Ha Giang and Ha Long Bay have four, Hanoi three, and Ninh Binh only two, August and September.
The central coast: October
Phong Nha, Hue, Hoi An and Da Nang, and Quy Nhon all have October as their wettest month. Hue is the wettest place on the map at 772.7 mm, followed by Phong Nha at 649.1 mm and Hoi An and Da Nang at 628 mm. Hue also has the longest wet season on this coast, with four months over 250 mm from September to December. Quy Nhon has only two, October and November.
A second record agrees on the central peak. The Japan Meteorological Agency's monthly normals put October first at both Hue, with 842.7 mm, and Da Nang, with 692.5 mm, and give Hue the same four months over 250 mm. Its totals run higher than the QCVN ones, and for Quy Nhon it puts November, at 532.6 mm, ahead of October.
For the same coast month by month, see Hoi An and Quy Nhon, and for storms see the typhoon season guide.

The south: August to November
The southern places do not share one peak. Phu Quoc peaks in August at 485.6 mm and passes 250 mm in six months, May to October, the longest wet season on the map. Da Lat peaks in September, the Mekong Delta and Con Dao in October, and Nha Trang in November at 381.6 mm. Da Lat has just one month over 250 mm, September at 283.4 mm.
This Vietnam Today report covers how the Mekong Delta turns its flood season into a tourism draw.

Asked why it was raining in the south during an El Niño year, one r/VietNam user replied:
"El Niño doesn’t mean dryer weather by default. Also the rainy season is from May to October down here."
u/lecithinxantham on r/VietNam
The dry months
February is the driest month at 8 of the 14 places in the table. December is the driest at Hanoi, Ha Long Bay and Sa Pa, March at Hue and Con Dao, and January at Da Lat. The three lowest totals in the table are in the south: 3.8 mm at the Mekong Delta in February, 9.1 mm at Da Lat in January and 11.2 mm at Con Dao in March. See the driest month guide for the mirror of this table.
The wettest single days
Monthly totals hide how much can fall at once. The QCVN table of the largest one-day rainfall at each station shows the central coast again at the top. Hue's record is 977.6 mm in a single day, in November. Dong Hoi, the station for Phong Nha, has 747 mm in October, and Da Nang 592.6 mm in November.
The north has its own extremes. Ninh Binh's one-day record is 450.9 mm in September, Hanoi's 394.9 mm in November and Ha Long Bay's 387 mm in July. Da Lat's is far lower at 177.4 mm, and the Mekong Delta station at Can Tho has 131.8 mm. A dry month on average can still produce one of these days.

Our take
There's no single month when the whole country is dry, but February comes closest: it is the driest month at 8 of the 14 places. If your route mixes the north and the centre, note that the north's wet months run to September, when the centre's begin, so a single trip in late summer can catch both. The central coast deserves the most caution. It has the highest monthly totals and the largest single-day records in the table.
How we checked this
Each row comes from tables A.25 and A.26 of QCVN 02:2022/BXD, one station per place, with JMA ClimatView normals as a cross-check for Hue, Da Nang and Quy Nhon. We recomputed the wettest month, driest month and months over 250 mm for all 14 stations on 8 October 2026 and matched them against the regulation PDF. We removed the Ho Chi Minh City model estimate. On 22 October we spot-checked five station rows in the PDF and re-read the JMA normals; nothing had changed. Last reviewed: 22 October 2026.
What this does not tell you
A month with less than 250 mm can still be rainy. The rain days guide explains why millimetres can mislead. Each row comes from a different station, some of them far from the map pin, and the regulation behind them does not state its observation period. Storms and floods are separate risks that monthly totals do not show.
References
- QCVN 02:2022/BXD, National technical regulation on natural physical and climatic data for construction: https://datafiles.chinhphu.vn/cpp/files/vbpq/2022/10/02-bxd.pdf. Checked 2026-10-08.
- Japan Meteorological Agency, ClimatView monthly normals for Hue (48852), Da Nang (48855) and Quy Nhon (48870): https://ds.data.jma.go.jp/tcc/tcc/products/climate/climatview/graph_mkhtml_nrm.php?n=48852&y=2026&m=8&e=7&r=1&s=1&k=0. Checked 2026-10-08.
Photo (cover): Sheila C / Unsplash
Data checked: October 2026.
About the author

Pen name for the weather and climate beat: rain, temperature, typhoons and when to go. Every comparison is built from official station records.
Keep reading
The driest month in Vietnam, from Sa Pa down to Phu Quoc
Guides · 5 min

Rain days vs millimeters: why the rainfall number misleads
Guides · 5 min

The coldest places in Vietnam, and when nights turn cold
Guides · 5 min

Vietnam weather in November: dry places and wet places
Guides · 5 min

Vietnam typhoon season 2026: which months hit which coast
Guides · 5 min

Where fog days matter in Vietnam: Sa Pa, Ha Giang, Ha Long
Guides · 5 min

North vs south Vietnam weather: Hanoi and the Mekong Delta
Guides · 5 min

Tet 2027 in Vietnam: dates, closures and when to book
Guides · 5 min
Disclaimer
This article is general information, not legal, immigration, medical or financial advice. Prices, visa rules and transport schedules change, and each figure shows the month we last verified it. Confirm anything that affects your trip (entry requirements, fees, health rules) with the official government or provider source before you book or travel. The site has no affiliate links today; our affiliate disclosure explains what we will do if that changes.